20 May 2026
WalletHub Analysis Ranks Nevada Highest Among States Prone to Gambling Addiction

WalletHub released its annual evaluation of states most susceptible to gambling addiction in May 2026, and the findings draw from a detailed examination of 20 distinct metrics divided across two primary categories. The study measures gambling-friendliness through factors such as the number of casinos per capita, gaming machines available, legal betting options, and lottery sales volumes, while the second category assesses gambling problems alongside treatment availability including rates of gambling disorders, Gamblers Anonymous chapter density, and access to support resources.
Observers note that this dual approach allows for a balanced view of both opportunity and consequence, since states with abundant gaming infrastructure often face elevated challenges in managing related disorders. Data compiled for the report reflects conditions through early 2026, incorporating various state demographic and economic statistics as of March 2026 to normalize figures on a per-resident basis where appropriate.
Methodology and Metric Breakdown
The analysis weights metrics to reflect both structural availability of gambling and measurable outcomes for residents, with researchers applying equal emphasis to each category so that friendliness indicators do not overshadow problem indicators. Specific inputs include counts of tribal and commercial casinos, slot machines and video lottery terminals, availability of sports betting and online wagering platforms, plus per-capita lottery ticket expenditures.
On the problems side, figures track estimated prevalence of gambling disorder drawn from national health surveys, combined with local resources such as certified treatment centers and meeting frequencies for support groups. Those who have reviewed similar past reports recognize how these elements together create a composite score rather than relying on any single data point.
State Rankings and Key Findings
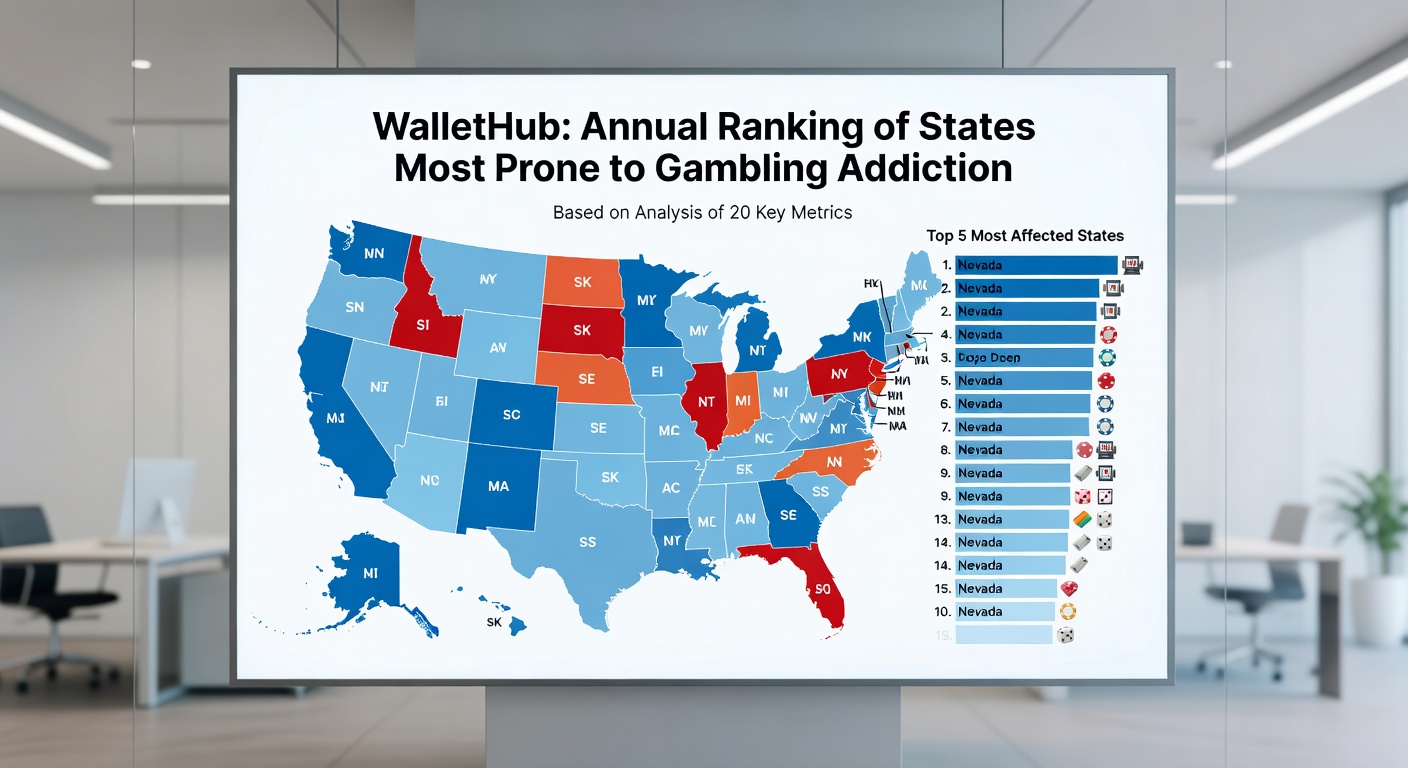
Nevada secured the top position in the 2026 ranking primarily because of its unmatched concentration of casinos and gaming machines relative to population size, a 2.7 percent rate of gambling disorder among adults, and regulatory frameworks that permit broad access without heavy restrictions. South Dakota followed in second place, driven by widespread video lottery terminals in bars and restaurants along with comparatively high per-capita participation rates.
Montana, Mississippi, and Louisiana rounded out the top five, each exhibiting dense gaming options combined with documented treatment gaps in certain rural areas. Experts highlight that these states share patterns of early adoption of expanded gambling formats, which correlates with higher visibility of associated issues in public health data. What's interesting here is how treatment availability sometimes lags behind the pace of new gaming introductions, creating measurable shortfalls in the overall scores.
National Gambling Landscape
Across the United States, consumers experience more than $100 billion in annual gambling losses even as the broader industry posts record revenues from both traditional casino floors and newer digital channels. The WalletHub findings place this aggregate loss figure in context by showing how state-level differences in regulation and infrastructure contribute to uneven distribution of risks.
States outside the top tier often benefit from stricter caps on machine numbers or mandatory contributions to treatment funds, which can improve their relative standing in the second category of the study. Observers note that even states with moderate gambling activity still report measurable disorder rates, underscoring that availability alone does not determine outcomes.
Implications for Treatment and Policy
The report underscores variations in Gamblers Anonymous meeting density, with some top-ranked states showing fewer sessions per 100,000 residents compared to lower-ranked ones despite greater exposure. Researchers point to this mismatch as one area where expanded outreach could shift future rankings, particularly as online gambling continues to grow in states that legalized it recently.
Figures reveal that treatment resources, when measured against population need, remain uneven nationwide, prompting some states to allocate portions of gaming tax receipts directly to counseling programs. Those who've tracked similar studies over multiple years see consistent themes around the value of pairing new gaming permissions with dedicated support infrastructure from the outset.
Conclusion
WalletHub's 2026 assessment provides a clear snapshot of how gambling environments and support systems interact across state lines, using standardized metrics to compare conditions that affect millions of residents. The top-ranked states illustrate concentrated risks tied to both high accessibility and documented disorder prevalence, while national loss totals exceed $100 billion annually amid ongoing industry expansion. Continued monitoring of these 20 metrics will likely shape discussions around balanced approaches to gaming regulation and public health resources in the months ahead.