27 Jun 2026
Tracing correlations between holiday spending patterns and elevated activity levels in digital gaming platforms across diverse user groups
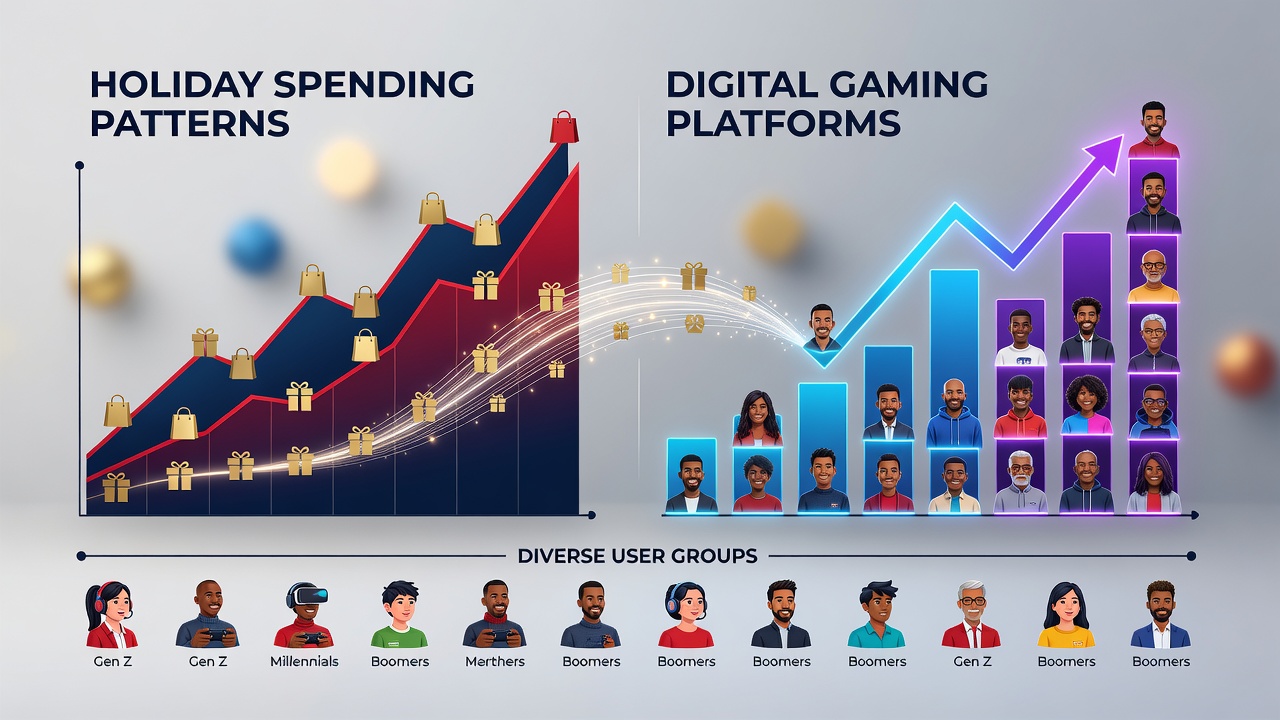 Holiday periods consistently produce measurable upticks in consumer expenditures, and analysts have tracked parallel increases in engagement metrics on digital gaming platforms that include online casinos, poker rooms, and interactive betting interfaces. Data collected across multiple years reveals that discretionary income released during festive seasons often flows toward both traditional retail purchases and virtual entertainment environments, creating observable overlaps in timing and user behavior. Researchers examining transaction logs from platforms operating in regulated markets note that login frequencies, deposit volumes, and session lengths rise in tandem with broader retail spending indicators during November through January windows. Demographic breakdowns show distinct patterns rather than uniform responses. Younger adults between 21 and 35 demonstrate the sharpest spikes in mobile platform activity during holiday weeks, frequently combining gift card redemptions or bonus offers with extended evening sessions. Middle-aged cohorts aged 36 to 55 tend to exhibit steadier but lower-intensity increases, often concentrating activity around specific promotional events tied to major holidays. Older user groups above 55 register more modest elevations, typically limited to shorter sessions on desktop interfaces. Geographic distribution adds further layers, with users in states that expanded iGaming access after 2020 showing stronger correlations between local retail sales data and platform traffic than regions with longer-standing regulatory frameworks. Studies of spending allocation indicate that households reporting above-average holiday outlays on gifts and travel also register higher average transaction sizes within digital gaming accounts during the same intervals. This relationship holds across income brackets yet varies in magnitude, with middle-income brackets displaying the clearest linkage according to aggregated operator reports. Payment method analysis further clarifies the picture: credit card deposits accelerate during the final two weeks of December, while e-wallet usage remains elevated through early January when post-holiday refunds and returns occur. Platform operators have documented that feature adoption rates, including loyalty program redemptions and tournament entries, climb alongside overall activity. One analysis of multi-state mobile data covering the 2024-2025 holiday cycle found a 28 percent rise in bonus wagering completions compared with non-holiday baselines, concentrated among users who also increased deposit frequency. Session management tools such as deposit limits and time reminders see mixed uptake, with adoption rates climbing more noticeably among users who maintain consistent activity patterns year-round. External economic indicators provide additional context. Figures released by the American Gaming Association track iGaming revenue contributions that align with national consumer confidence indices measured in the same quarters. Parallel observations from the Statistics Canada gambling statistics series reveal comparable seasonal alignments in provinces with mature online markets, underscoring that the pattern crosses regulatory boundaries. Academic reviews of anonymized player datasets have begun isolating variables such as age, location, and payment type to refine predictive models for peak periods.
 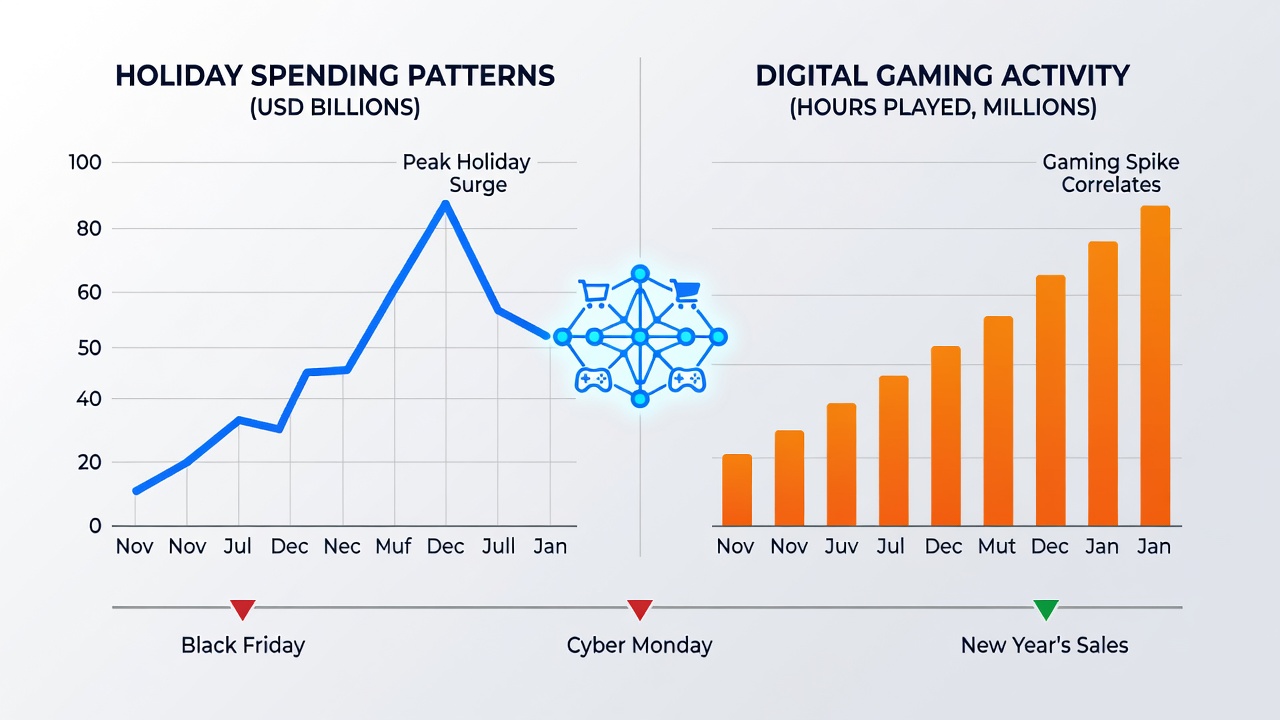 June 2026 data releases from several state gaming commissions have supplied fresh benchmarks against which prior holiday cycles can be compared. Preliminary tallies indicate that platforms continue to experience residual effects from the preceding winter period, with user retention metrics remaining elevated into the second quarter for cohorts that first increased activity during December promotions. Analysts attribute part of this persistence to habit formation around mobile interfaces introduced or upgraded ahead of the holidays. Cross-platform comparisons highlight differences between casino-style games and skill-based offerings. Slot and table game volumes expand more uniformly across age groups, whereas poker and tournament participation shows sharper concentration among users already demonstrating higher engagement outside holiday windows. Deposit timing data suggests that many users coordinate gaming expenditures with paycheck cycles that coincide with holiday bonuses or tax refunds, producing clustered activity peaks rather than steady distribution. Researchers continue to refine segmentation models that incorporate both macroeconomic signals and platform telemetry. These efforts rely on anonymized datasets shared under regulatory reporting requirements, allowing for longitudinal tracking without individual identification. The resulting correlations supply operators and policymakers with timing information for resource allocation, responsible gaming messaging, and promotional scheduling. Patterns observed thus far point to recurring seasonal dynamics that repeat across diverse regulatory environments and user populations.