13 Jun 2026
Interface Design Influences on Player Time Allocation in Poker Tournaments and Cash Games
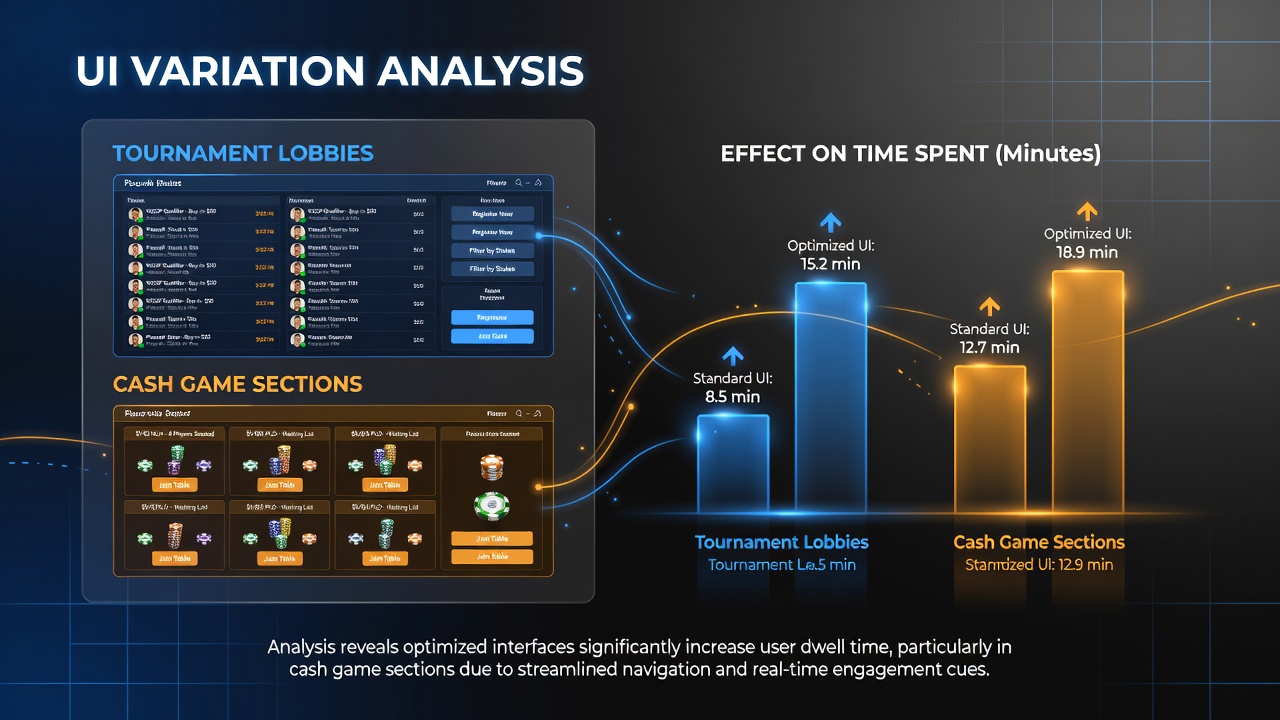
Platform operators have tracked how different user interface layouts affect the duration players remain in tournament lobbies compared with cash game sections, and data collected through June 2026 shows distinct patterns emerging across major sites. Tournament lobbies often feature prominent countdown timers, structured payout tables, and registration buttons arranged in a grid format, whereas cash game sections typically present seat availability maps with real-time stack sizes and filter options that allow quick game selection. Researchers at several academic institutions have examined these differences through platform analytics, noting that the visual hierarchy in tournament areas tends to guide users toward commitment decisions more rapidly than the flexible navigation found in cash game zones.
Key Layout Elements in Tournament Lobbies
Tournament interfaces frequently display a central leaderboard alongside upcoming event schedules, and this arrangement connects directly to extended viewing periods as players scan multiple options before selecting a buy-in level. Filters for buy-in ranges, blind structures, and player capacity appear in collapsible panels that reduce cognitive load, yet the presence of animated progress bars for late registration creates a sense of urgency that can shorten initial browsing time. Observers note that when these elements cluster together without excessive scrolling requirements, average session lengths in tournament sections increase because users remain engaged while monitoring entry deadlines and prize pool growth indicators.
Design Features Common in Cash Game Areas
Cash game sections rely on horizontal scrolling tables or card-based previews that highlight table stakes, player counts, and average pot sizes, allowing individuals to switch between variants such as Texas Hold'em and Pot-Limit Omaha with minimal clicks. The absence of fixed start times means these interfaces emphasize immediate seat joining, and data indicates that prominent "join now" prompts combined with live chat overlays correlate with shorter overall dwell times as players move quickly between tables. Color-coded indicators for table action speed and rake percentages further streamline decisions, leading to more frequent transitions rather than prolonged stays within a single view.
Studies comparing these two environments have identified several measurable effects on time allocation. One analysis of aggregated user logs from multiple operators revealed that players spent an average of 12 minutes longer in tournament lobbies when the interface included persistent notifications about satellite qualifiers, while cash game sessions averaged shorter intervals punctuated by rapid table switches. The placement of account balance displays also plays a role, with tournament designs often positioning this information in the upper corner to encourage sustained participation, whereas cash sections integrate balance updates directly beside active tables to support ongoing betting adjustments.
Comparative Data Patterns Observed in 2026
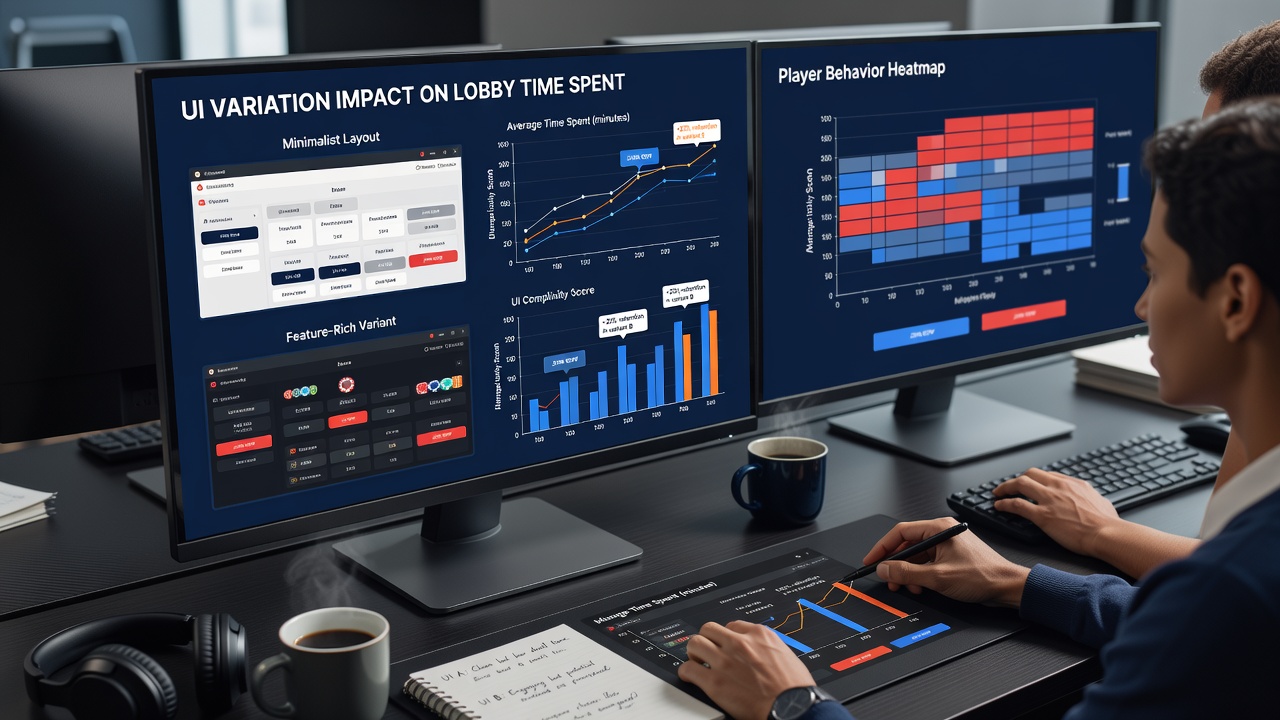
Figures compiled through the first half of 2026 demonstrate that variations in button prominence and information density produce measurable shifts in engagement duration. Tournament lobbies with larger, high-contrast registration buttons recorded higher initial click-through rates yet longer subsequent idle periods as users waited for events to fill, and cash game interfaces featuring dynamic sorting by profitability metrics showed increased movement between tables within shorter windows. A report from the American Gaming Association highlights similar trends in digital poker traffic, where layout adjustments implemented in early 2026 led to redistribution of session lengths across these two categories without altering overall platform activity levels.
Additional factors such as mobile responsiveness and dark mode defaults have influenced outcomes, since tournament views often retain more static elements that render consistently across devices, while cash sections adapt fluidly to smaller screens with touch-friendly sliders. Those who have reviewed platform heatmaps point out that eye-tracking simulations indicate users linger on tournament payout structures longer than on cash game stake selectors, creating natural extensions of time in one area over the other. Regulatory updates in several jurisdictions during this period encouraged clearer display of time-based warnings, which operators incorporated into both lobby types and observed modest reductions in extended sessions across the board.
Additional Variables Affecting Engagement Duration
Integration of social features, including friend lists and chat windows, appears more prominently in cash game sections, and this can fragment attention leading to quicker exits when conversations pull focus away from table selection. Tournament lobbies, by contrast, prioritize event-specific details like overlay amounts and guarantee thresholds that keep attention centered on a single decision point for extended intervals. Data from Canadian provincial gaming authorities has documented parallel behaviors in regulated markets, where interface tweaks aimed at responsible play prompted slight increases in time spent reviewing tournament rules before entry.
Seasonal promotions tied to major sporting events in June 2026 further modulated these patterns, as temporary banners in tournament areas extended browsing periods while cash game sections saw faster turnover due to overlay incentives that encouraged immediate play. The positioning of these promotional elements relative to core navigation tools determined whether they prolonged or abbreviated overall interaction times in each section.
Conclusion
Platform analytics continue to demonstrate that targeted adjustments to visual hierarchy, notification systems, and filter mechanisms produce consistent differences in how long users remain within tournament lobbies versus cash game sections. As operators refine these designs based on ongoing data collection, the relationship between interface variations and time allocation remains a key area of observation for industry stakeholders seeking to understand player navigation habits across digital poker environments.