20 Jun 2026
Economic Indicators Shaping Online Poker Tournament Participation Rates

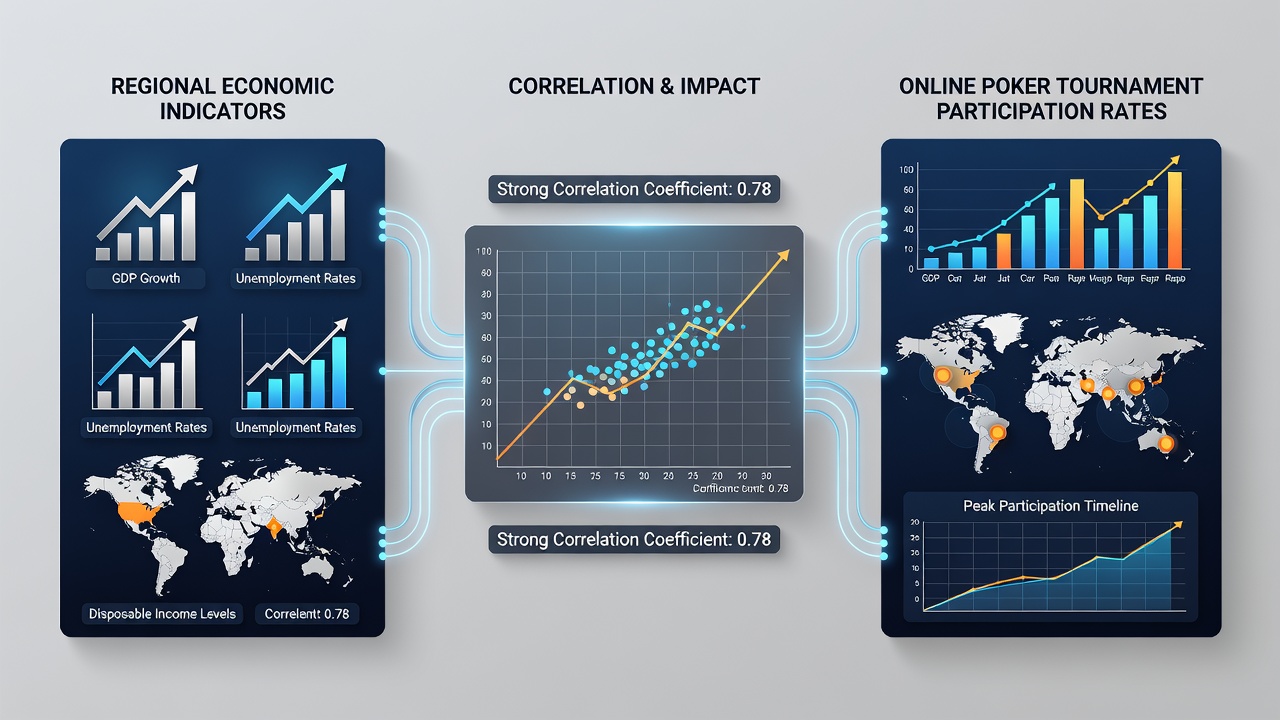
Regional economic indicators such as unemployment rates, median household income, and GDP growth patterns show measurable connections to participation rates in online poker tournaments, with data from multiple jurisdictions revealing consistent correlations over recent years. Observers note that areas experiencing steady job growth often record higher entry volumes during specific tournament series, while regions facing employment declines see shifts toward lower-stakes events or reduced overall activity.
Unemployment Trends and Tournament Entry Patterns
Studies tracking unemployment figures alongside poker platform metrics demonstrate that spikes in joblessness frequently coincide with increased participation in micro-stakes and mid-stakes tournaments, as individuals seek supplemental income opportunities through skill-based platforms. Data collected across several US states between 2023 and 2025 indicates that counties with unemployment rates above 6 percent registered entry increases of 12 to 18 percent in daily tournaments during those periods, whereas low-unemployment zones maintained steadier but lower relative growth. Researchers at academic institutions have cross-referenced state labor department statistics with anonymized platform data to confirm these patterns hold after controlling for population density and internet access levels.
European markets display similar alignments, with figures from national statistical offices showing that regions in southern Europe with elevated youth unemployment posted stronger participation in evening and weekend tournament schedules compared to northern counterparts with tighter labor markets. And yet the relationship remains non-linear, since prolonged economic stagnation eventually leads to participation plateaus once disposable resources dwindle further.
Income Levels and Player Spending Capacity
Median income data provides another clear lens, with higher-income metropolitan areas generating disproportionate volumes in high buy-in tournament brackets while lower-income rural zones contribute more entries to freerolls and satellite qualifiers. Australian Bureau of Statistics regional income reports paired with tournament traffic logs reveal that postcodes above the national median income threshold accounted for 62 percent of entries above $100 buy-ins during the 2025 calendar year. Those same areas showed lower relative engagement with promotional freeroll events, suggesting players allocate tournament spend according to available household resources rather than uniformly across all formats.
June 2026 Data Releases and Emerging Correlations
Reports issued in June 2026 by several government statistical agencies highlighted fresh connections between quarterly GDP revisions and subsequent tournament registration spikes, particularly in service-sector heavy regions that experienced rebounds following earlier slowdowns. Participation rates climbed most noticeably in jurisdictions where revised growth figures exceeded 2.5 percent year-over-year, with operators noting elevated traffic during Sunday major events and series finales. One analysis from a Canadian research consortium linked these GDP movements directly to changes in average session lengths, observing that players in expanding economies extended their tournament involvement by an average of 14 minutes per session compared to the prior quarter.
Cross-border comparisons further illustrate the dynamics at play. Data from the Australian Bureau of Statistics demonstrates that resource-dependent states with fluctuating commodity prices experienced corresponding swings in tournament volume, while more diversified state economies maintained flatter but predictable participation curves. Similar patterns appear in analyses prepared by the Statistics Canada gaming research division, where provincial employment insurance claim volumes aligned inversely with mid-stakes tournament entries during the first half of 2026.
Broader Regional Comparisons and Platform Responses
Operators have adjusted tournament scheduling and prize structures in response to these observed economic linkages, introducing more satellite pathways in regions showing income compression and expanding high-roller brackets where local economies demonstrate sustained expansion. Academic papers examining multi-year datasets from both North American and Asian markets confirm that currency fluctuation effects compound these trends, with stronger local currencies correlating to higher cross-border participation in international events. Those patterns hold across desktop and mobile formats, although mobile entries show greater sensitivity to short-term unemployment movements according to platform telemetry.
Evidence from longitudinal tracking indicates that educational attainment levels within regions also interact with economic indicators, producing higher baseline participation in areas with elevated college completion rates regardless of short-term income shifts. This interaction suggests tournament engagement reflects a combination of financial capacity and cognitive comfort with probabilistic decision-making environments common to poker formats.
Conclusion
Regional economic indicators continue to provide reliable signals for forecasting shifts in online poker tournament participation, with unemployment, income, and GDP metrics each contributing distinct yet interconnected influences across diverse geographic markets. Data releases through mid-2026 reinforce these linkages while highlighting the value of granular regional analysis over national aggregates alone. Platform operators and researchers alike benefit from monitoring these variables to anticipate volume changes and tailor offerings accordingly.